VARIFORC
VARIFORC is totally new approach to generating FORC diagrams, developed by Ramon Egli. Before using this feature, users should first read the following paper (and please cite this paper when using this feature in your published research):
Step 1. You should start by loading in a dataset in the normal way using the “Load FORCs” or “Load FORCs new format” options. If necessary at this stage you should perform the conversion from cps to SI units and/or apply a mass normalisation (use the “Convert cgs to SI units” and “Mass Normalise FORC data” options in the FORCinextras menu). Next you should process the data using the conventional FORCinel method by selecting “Process FORCs” in the FORCinel menu. If necessary, apply the drift correction to the data. Once you are happy with the conventional FORC diagram, you are now ready to explore the VARIFORC method.
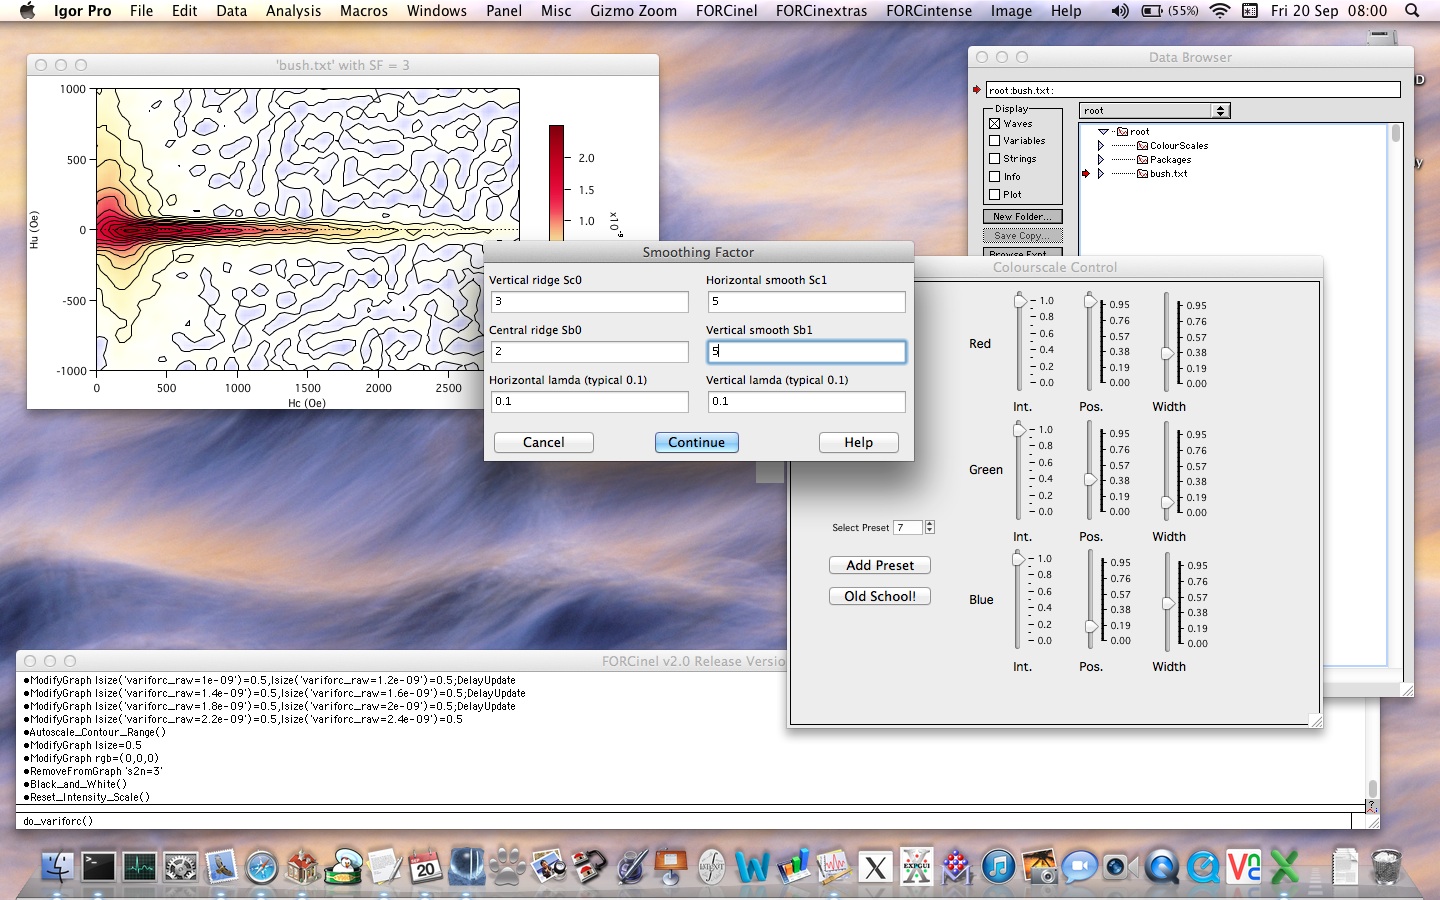
Step 2. Select “VARIFORC Processing” from the FORCinextras menu. You will be presented with a dialogue box asking you to enter values for the smoothing parameters Sc0, Sc1, Sb0, Sb1, horizontal lambda and vertical lambda. For a full explanation of these parameters, see Egli (2013):
Sc0 = Starting smoothing factor in horizontal direction to be used along the vertical ridge at Hc = 0
Sc1 = Starting smoothing factor in horizontal direction to be used just outside the vertical ridge region
Sb0 = Starting smoothing factor in the vertical direction to be used along the central ridge
Sb1 = Starting smoothing factor in the vertical direction to be used just outside the central ridge
lambda horizontal = rate of increase in smoothing factor with hc along the horizontal direction
lambda vertical = rate of increase in smoothing factor with hc along the vertical direction
Typically you should use values of Sc0 = 3, Sb0 = 2 or 3, Sb1 = Sc1 = ≥ 3 and lambda horizontal = lambda vertical ~ 0.1. Small values of Sb0 combined with high values of sb1 = sc1 are recommended for revealing the presence of a central ridge.
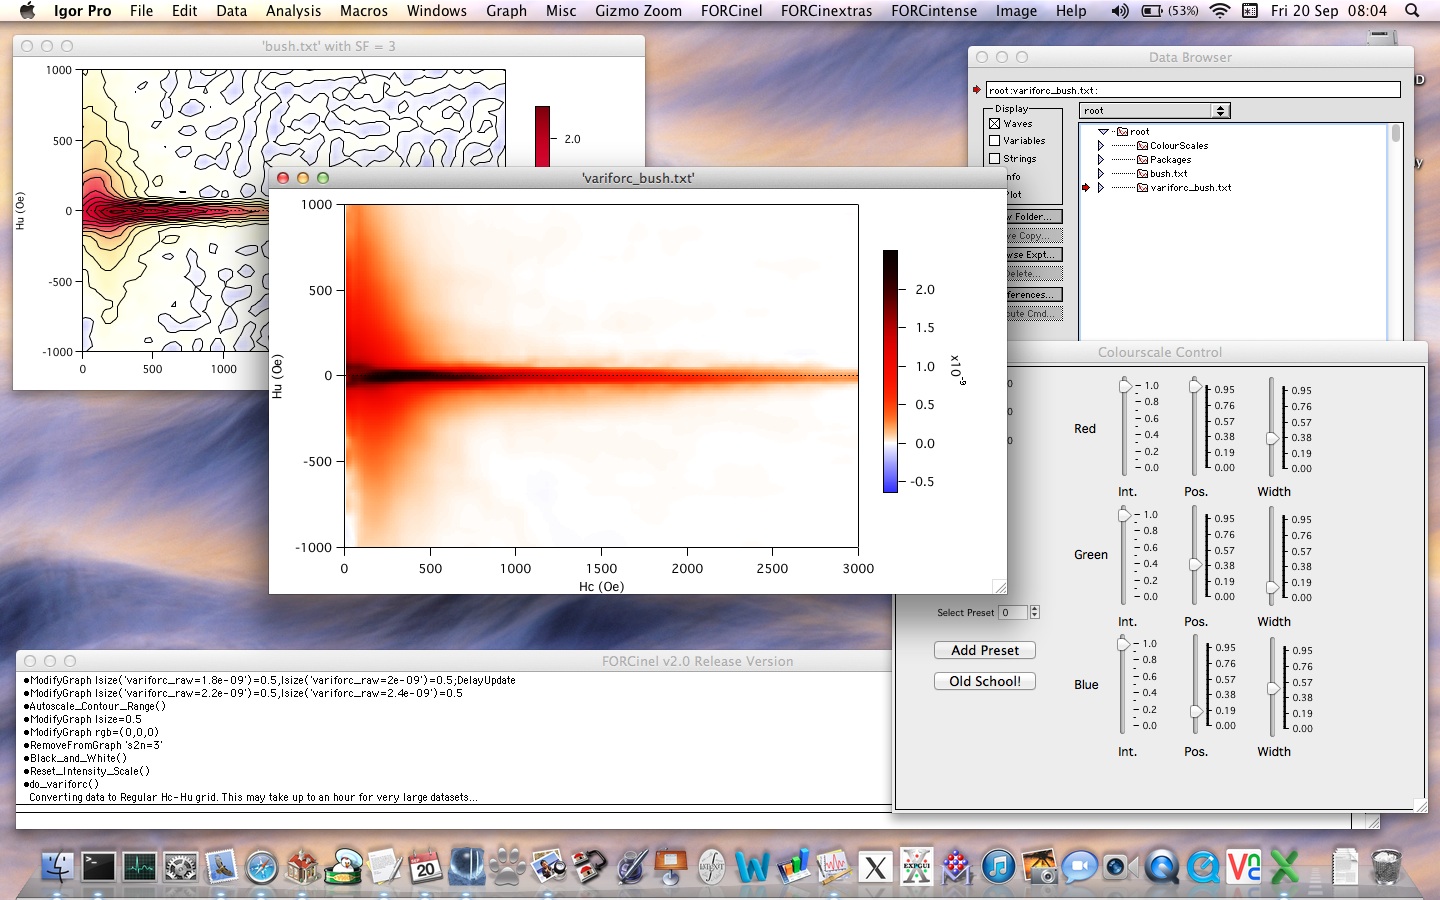
Step 3. After pressing continue, the VARIFORC processing will begin. For a typical dataset this will take just a little longer than the normal FORCinel processing. However, for large datasets with high numbers of FORC curves this can take much longer. The initial processing step is always longest, as this involves re-gridding the data. After that, changing the smoothing factor is much quicker. When the processing is done you should obtain a FORC diagram with the default colour scale.
Step 4. Select “VARIFORC Add Signal to Noise” from the FORCinextras menu. This will add a contour showing the limits of statistical significance of your data. Data inside this contour can be treated as real signal, data outside it are noise. To remove the contour once you are done, choose “Remove from graph” from Igor’s Graph menu.

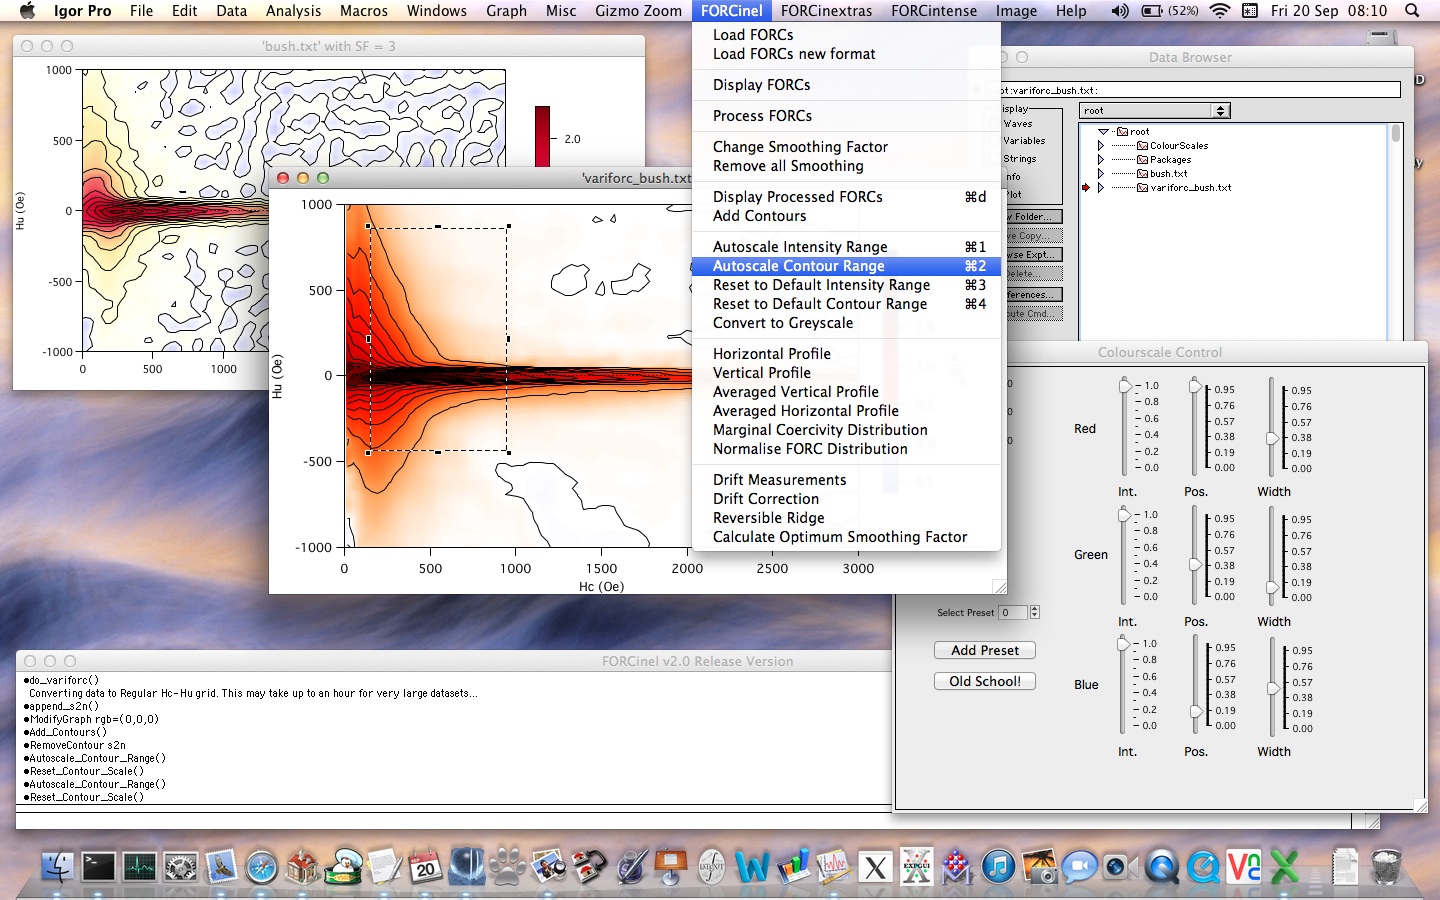
Step 5. Add contours to the FORC diagram using the “Add Contours” option in the FORCinel menu. To optimise the contour levels drag a marquee selection over a region of the FORC diagram and then choose “Autoscale Contour Range” from the FORCinel menu (or press cmd+2 or cntrl+2).
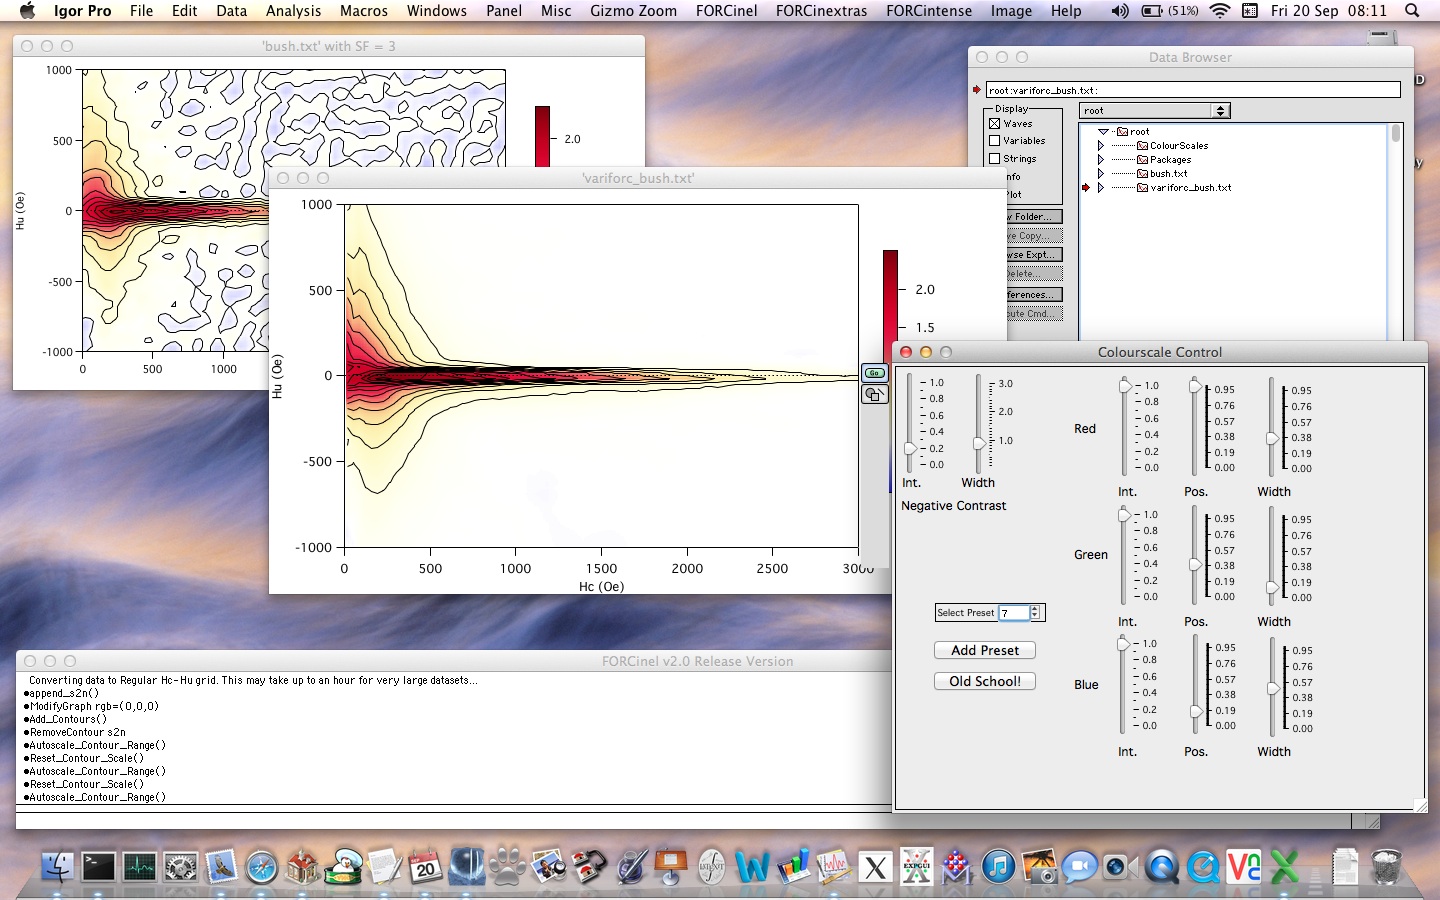
Step 6. Adjust the colour scale as desired. Here we are choosing preset number 7.
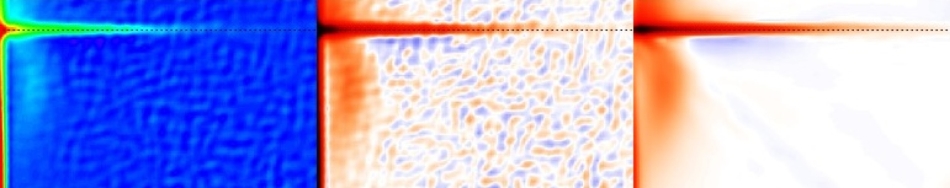
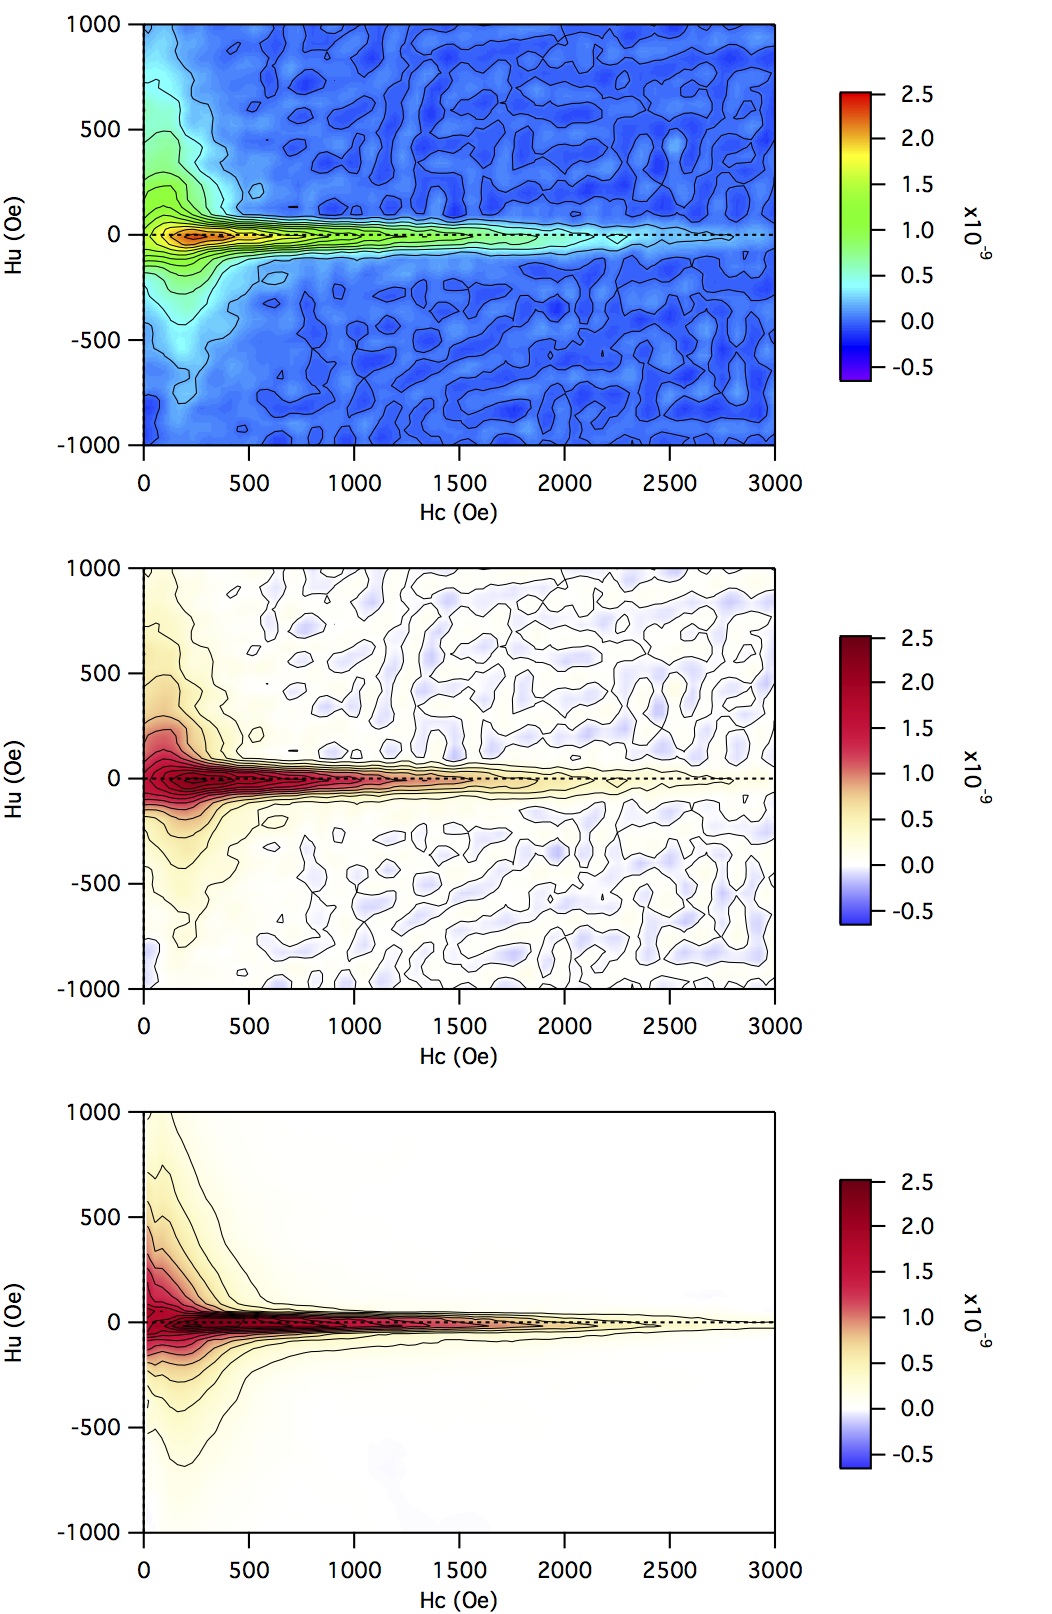
Step 7. Below is a comparison of the same FORC diagram processed using a) FORCinel using the Rainbow colour scheme, b) FORCinel using the new colour scheme, and c) VARIFORC using the new colour scheme. Notice the dramatic improvements in the smoothness and signal to noise of the VARIFORC version that come without the undesired distortion of the FORC distribution that you would get by using the FORCinel algorithm with high smoothing factors.
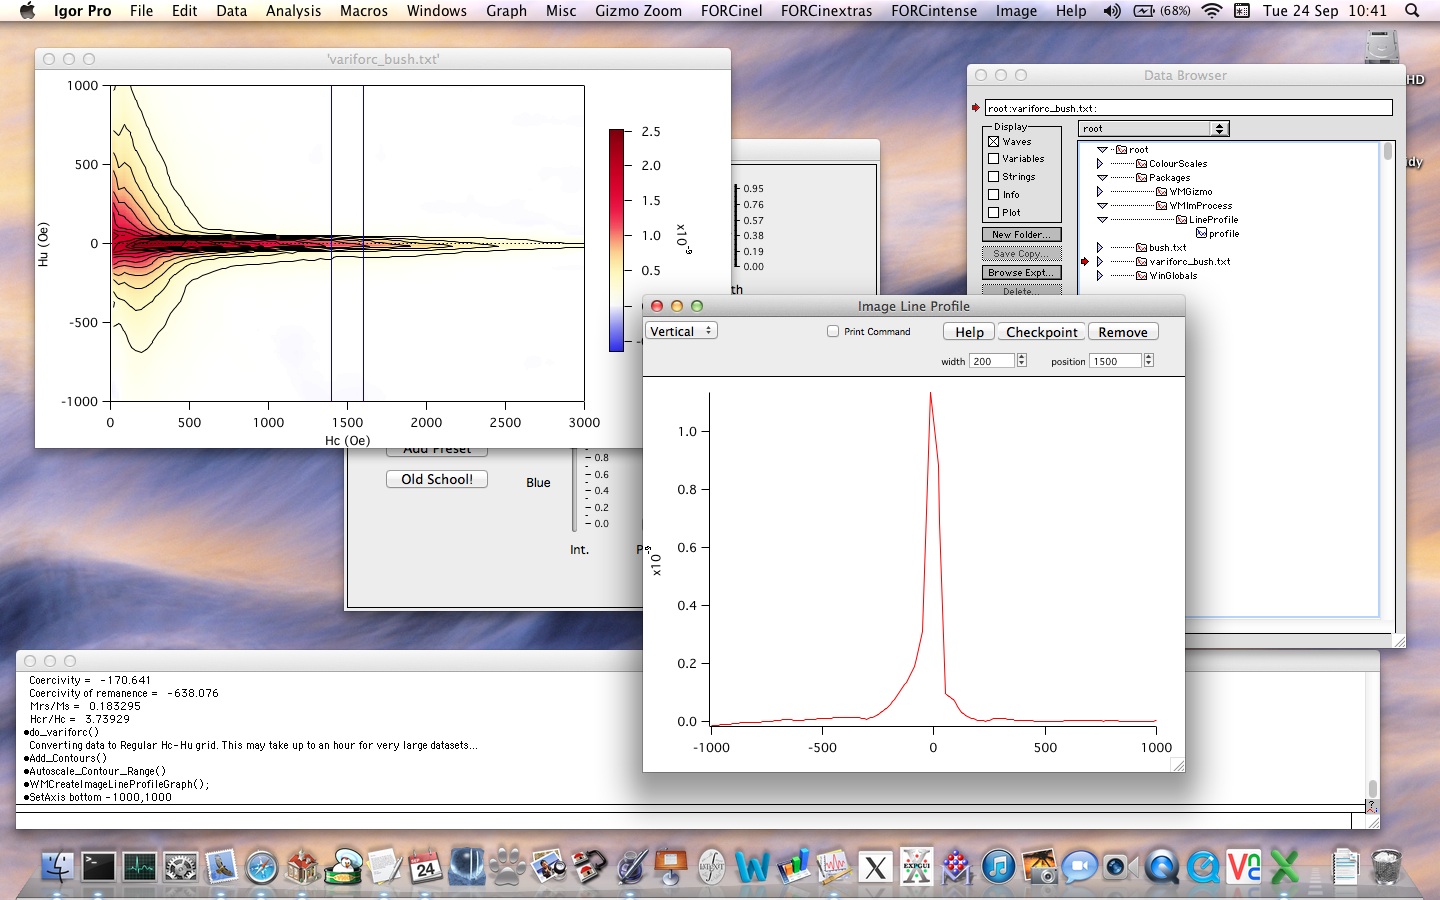
Step 8. To investigate coercivity and interaction field profiles, you can now use the built-in image processing features of Igor with VARIFORC data. Click on the FORC diagram and choose the Image:Image Line Profile option.
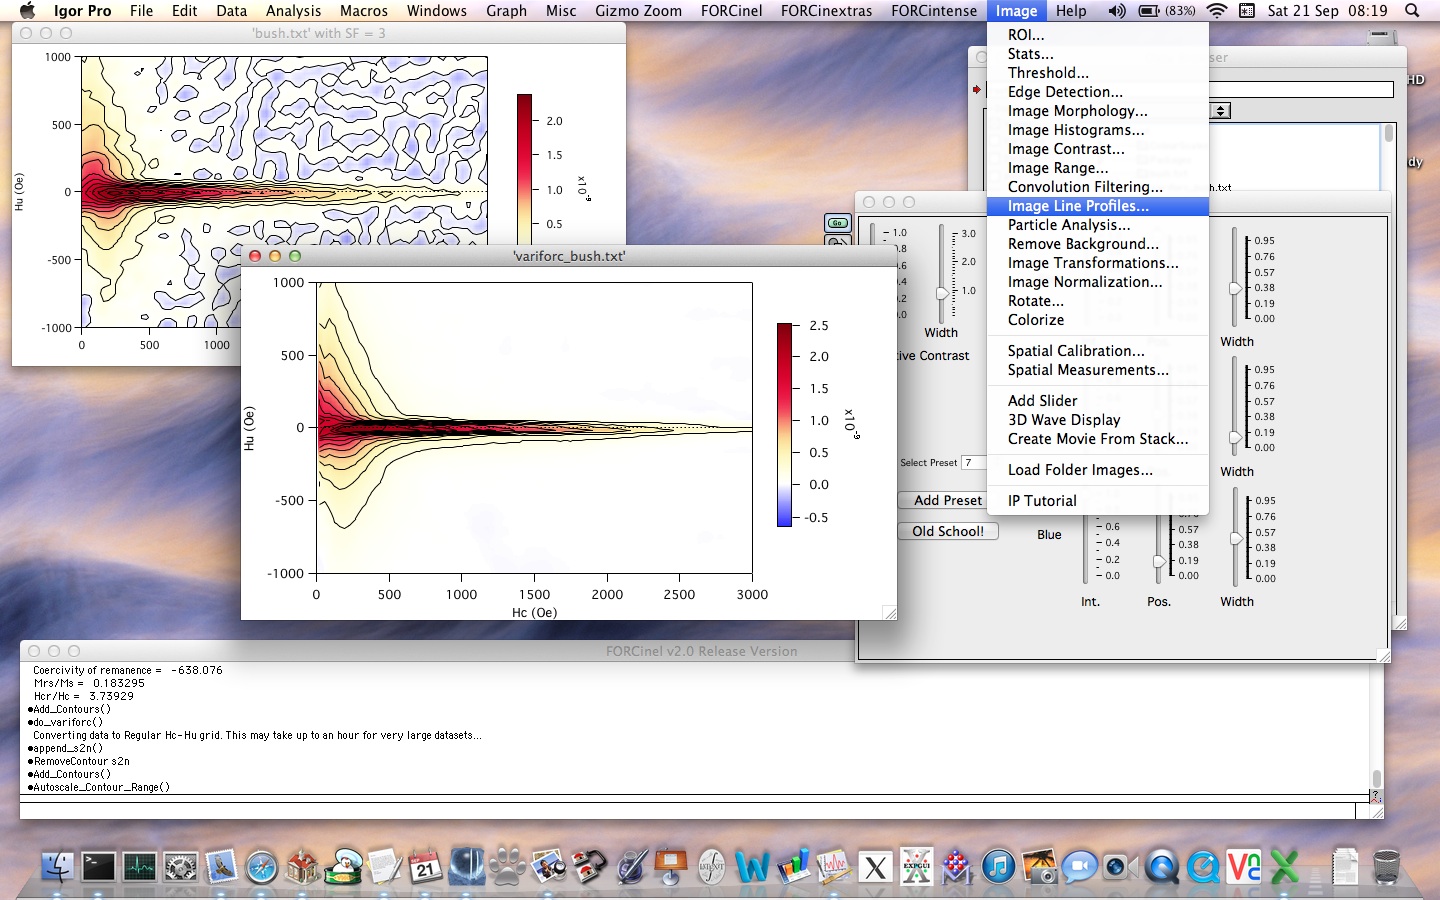
Step 9. You can choose horizontal, vertical or even free hand profiles! Use the input boxes to set the integration range and profile position. The profile data can be found in the data folder Packages:WMImProcess:LineProfile.