
New Update: FORCinel 2.02 Now Available
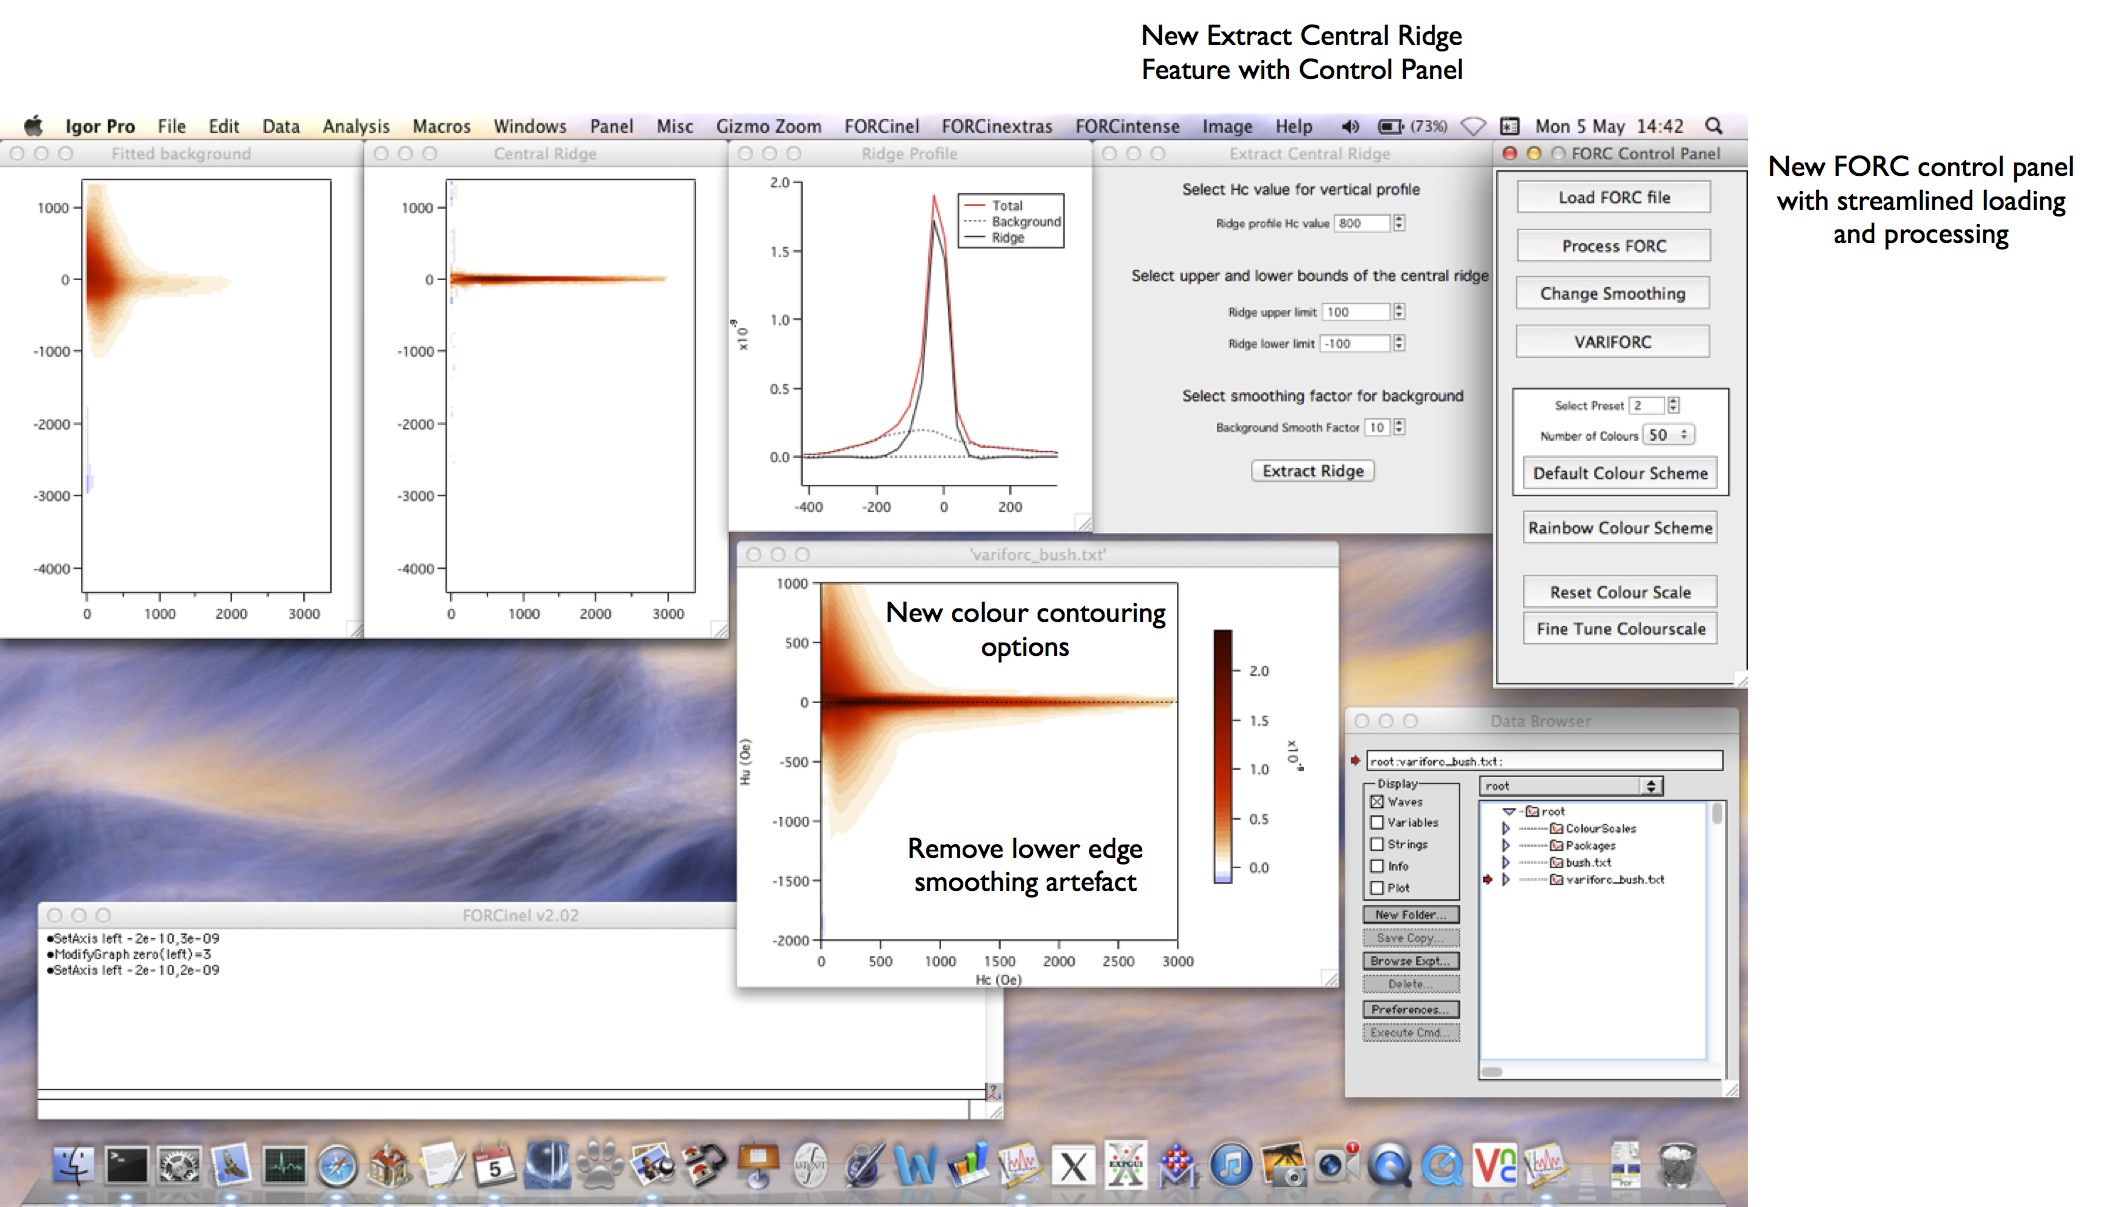
I am pleased to announce a new significant update to FORCinel (version 2.02). This version includes significant improvements to the user interface of FORCinel and a much more streamlined workflow for loading and processing FORC diagrams, as well introducing some major new features such as the new “Extract Central Ridge” feature (see screenshot below). Go to the download page to download the latest version.
Changes in version 2.02:
1. Made a single Load FORCs command that can now automatically recognise whether file is old format or new format. User no longer has to decide which file type is which.
2. Simplified and streamlined the loading process – no user input is required when loading the data. Operations that needed user input before are now only performed when the user chooses the “Extract Day Plot Option”.
3. Created control panel for loading, processing and smoothing FORCs, together with simplified options for changing the colour scale. Full control of the colour scale is now contained in a separate control panel called “Fine Tune Colourscale”. Buttons have been added to switch between the default and rainbow colour scales, and behaviour is now consistent when using the autoscale and reset colour scales. Added “reset colour scale” button to quickly reset colour scale to its default range.
4. Rearranged menu items into more natural groupings. Items relating to displaying FORCs, smoothing FORCs, changing the colour scale and changing the contours are grouped together. Related to this is a change in the keyboard shortcuts for autoscaling and resetting intensity scales and contour levels.
5. New display option to limit the colour resolution of the default colour scale via a pop-up menu on the main control panel has been added. This enhances the usefulness of the default colour scale by creating a subtle contour effect. Previous version used 500 colours to define the colour scale. Now you can restrict this to a lower value which also reduces the amount of unnecessary noise in the diagram.
6. New major feature: Extract Central Ridge. Uses a new background removal algorithm to allow users to extract and isolate the central ridge signal from samples containing obvious single domain signals. The method works by the user first defining a range of Hu values that define the vertical extent of the ridge. The ridge region is blanked out, leaving only background signal. The Loess smoothing algorithm is then used to fit a smooth function to the background signal and automatically extrapolate across the gap. Removing the smoothed and extrapolated background function leaves the central ridge. The control panel allows you to plot a profile of the extracted ridge and background functions, change the size of the ridge window, and choose the smoothing level for the background fit.
7. Added “Remove lower edge artefact” option. When using VARIFORC, there is typically an artefact on the lower edge of the FORC diagram, where the smoothing box intersects the edge of the measured data range. Removing this region not only looks nicer, but prevents the colour scale from being skewed by large signal values in this region. Signal is removed below a line drawn at 45° to the Hc axis, which intersects the Hu axis at a user-defined value. After removal it is recommended to press the “reset intensity scale” button in order to autoscale the intensity range. Simply change the smoothing factor again to restore the original FORC diagram without the edge removed.
8. Added “Attempt Rescue of Bad Data” option. In rare cases when the fields applied during measurements are not monotonic (due to some unforeseen experimental problem), this can cause the FORC diagram to fail to display (just a blank window appears). I get a couple of requests from users a year with this problem. Running this command will manage to correct for the error in the raw data, allowing the FORC diagram to be plotted as normal.
9. Fixed display bug that caused contours to change style when adding the signal-to-noise contour.
10. Enabled ‘Remove First Point Artefact’ for VARIFORC processed data. Note, however, that this option may require you to increase the smoothing factor along the vertical ridge to a value of AT LEAST 4 in order to have enough points to do the fit.
11. Fixed bug that would show an error when choosing autoscale contour range on a graph that had no contours.
12. Fixed bug in FORCintense that caused incorrect calculation of Preisach distribution.
Leave a Reply